See your LinkedIn acceptance rate, outreach and growth in one chart
LinkedIn does not show what share of your invites were accepted. Ask LinkedAsk in plain English and it builds the chart from your own activity, ready to save to your dashboard.
Sent invitations
- SHSarah HaddadTalent Partner at an early-stage fund3 days ago
- MBMarco BianchiEngineering Manager, Platform1 week ago
- ISInes SilvaTechnical Recruiter, infra and data2 weeks ago
- RSRavi SharmaAccount Executive, mid-market3 weeks ago
- CDClara DuboisChief of Staff to the CEO1 month ago
No acceptance rate
You get names, one at a time. Nothing adds them up by week or tells you what share said yes.
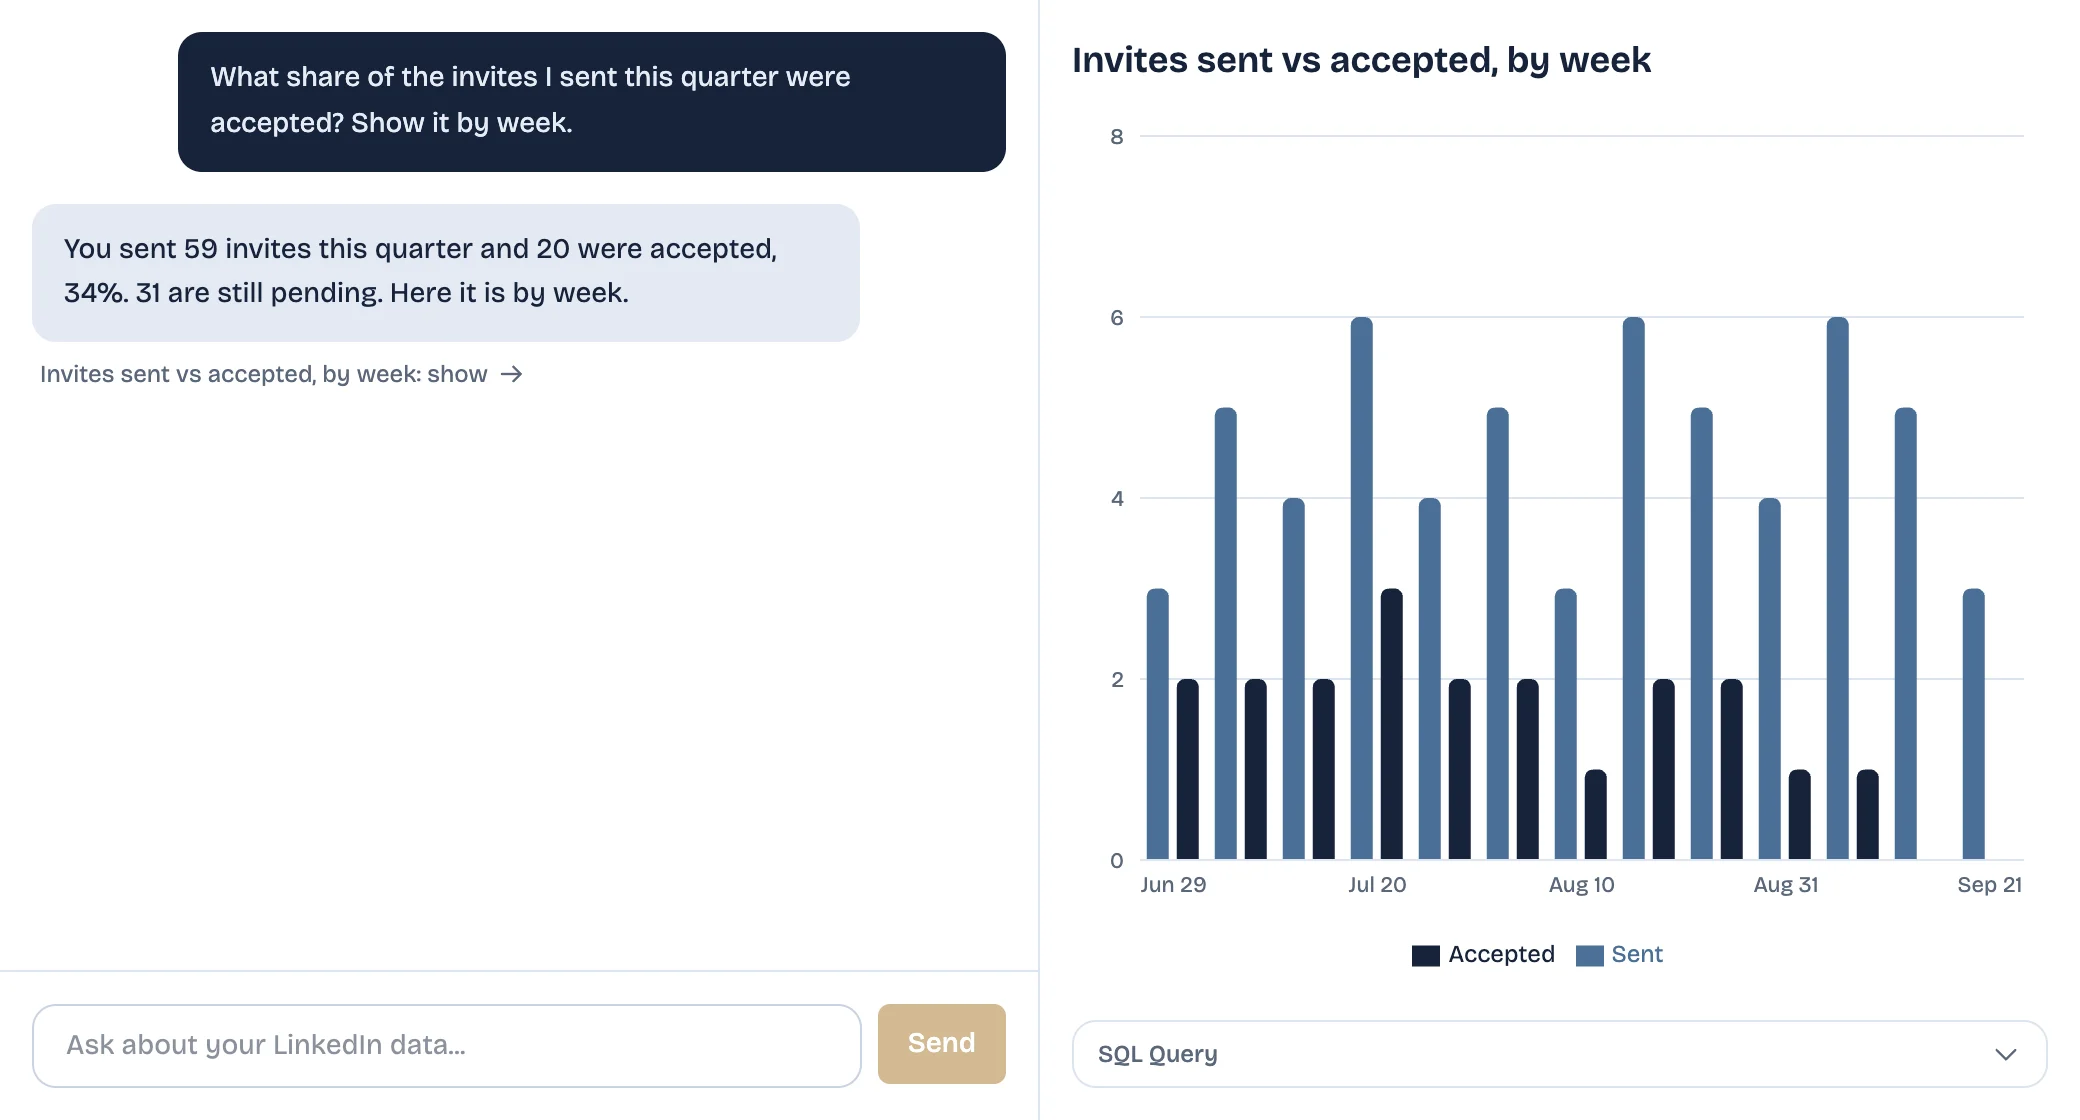
Can you see your LinkedIn connection acceptance rate?
Not on LinkedIn. It keeps a page of the invitations you sent, but it does not give you an acceptance rate. LinkedAsk is a Chrome extension that records each invite you send and whether the person connected, with the dates. Ask its chat “what share of my invites were accepted this month” and you get the number and a chart, built only from your own activity.
Updated September 2026.
Set up once, then ask
Add LinkedAsk to Chrome
Install the extension and sign in.
Use LinkedIn as usual
Your visits, invites, connections, profile viewers and reactions are kept with their dates.
Ask in plain English
Type a question in the chat. You get an answer and a chart, and you can ask a follow-up to change it.
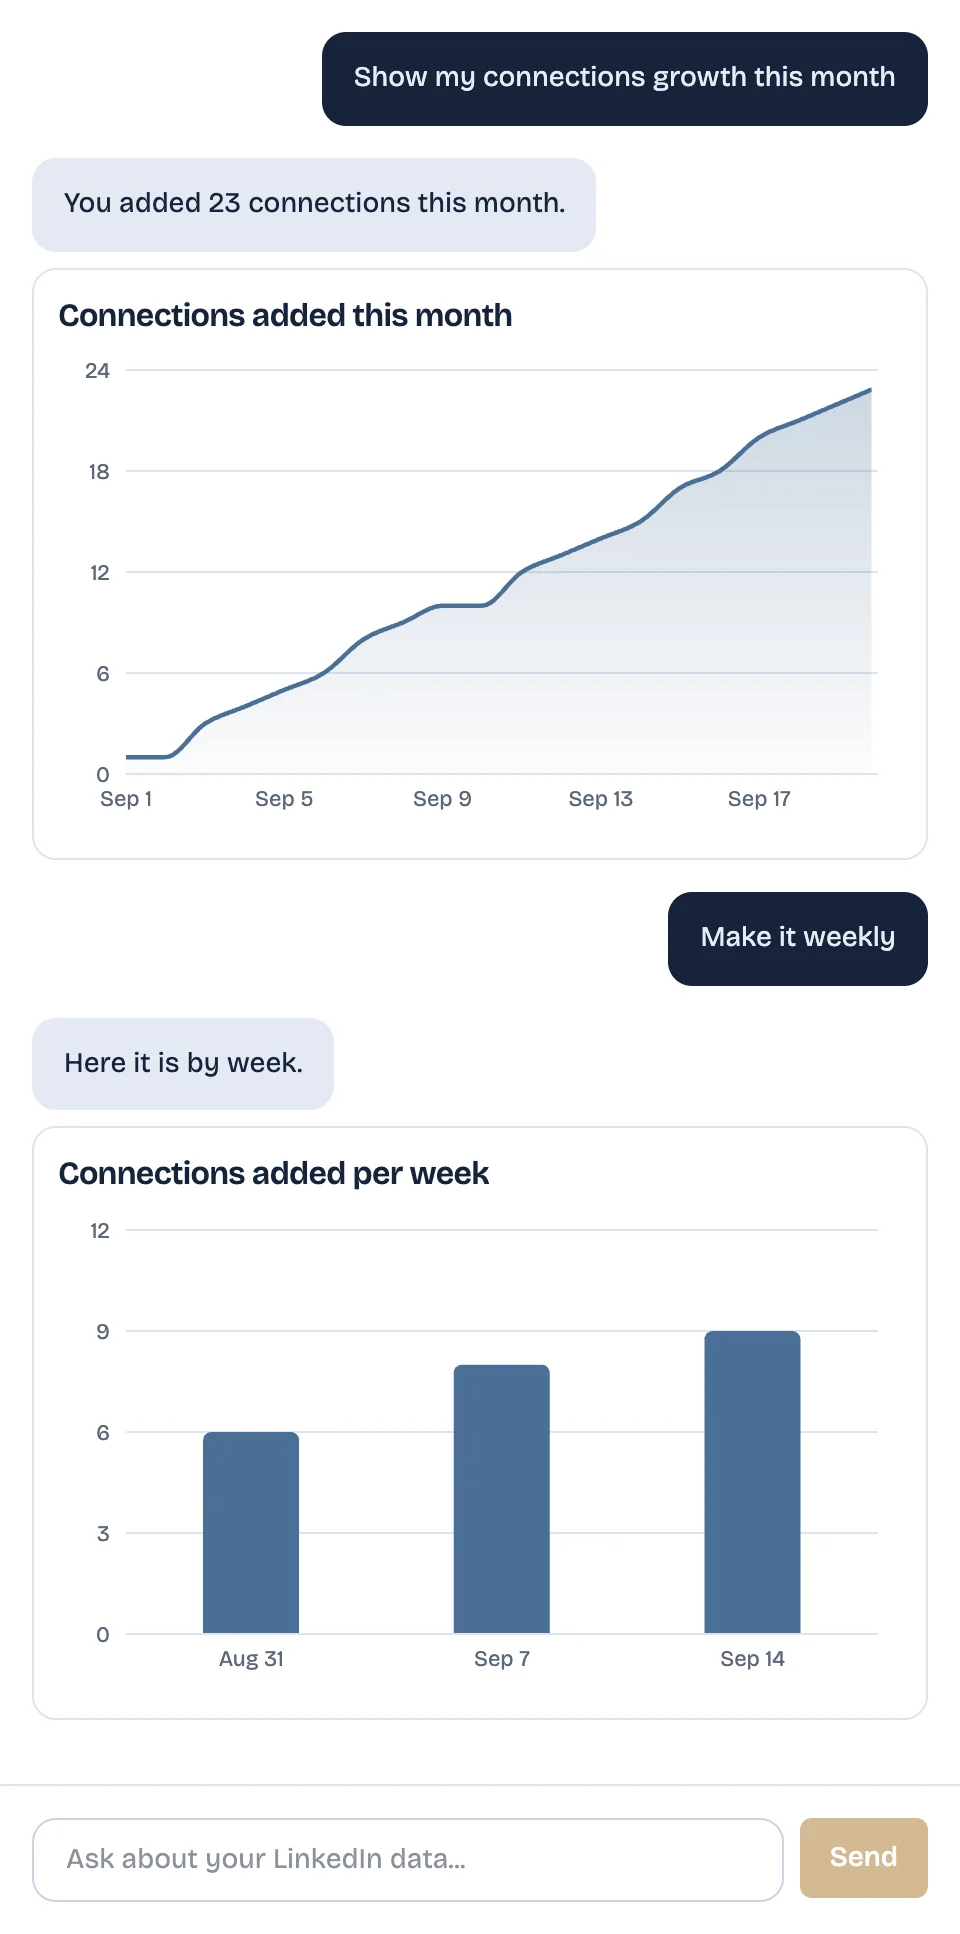
What you can ask for
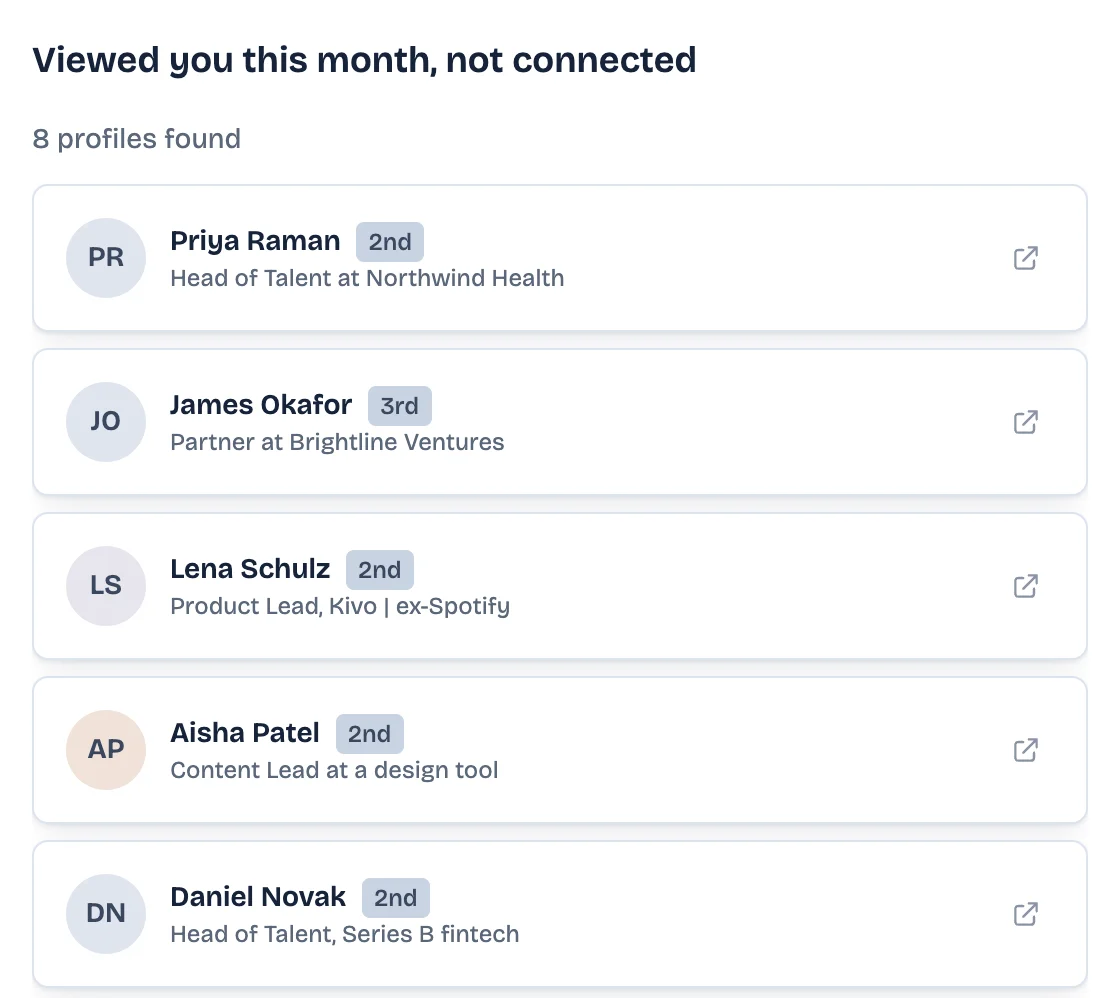
Lists of people, not just numbers
Ask for people and you get names with headline and connection degree, like everyone who viewed you this month that you are not connected with.
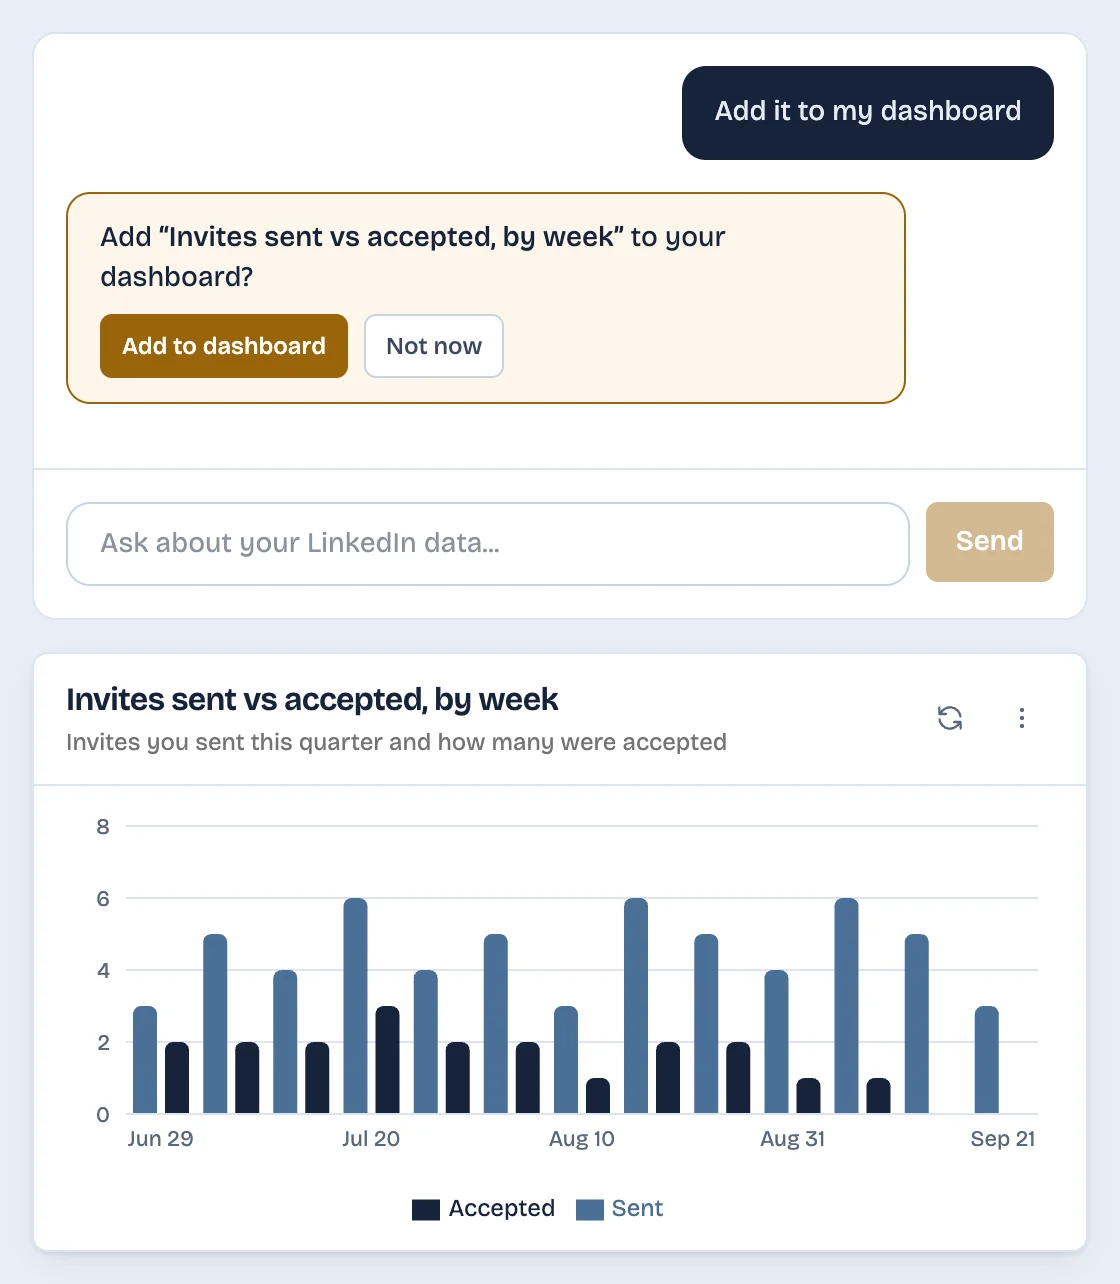
Save it, and it stays current
Ask to add a chart to your dashboard and the chat checks with you first. On the dashboard it runs again on your latest data each time you open it.
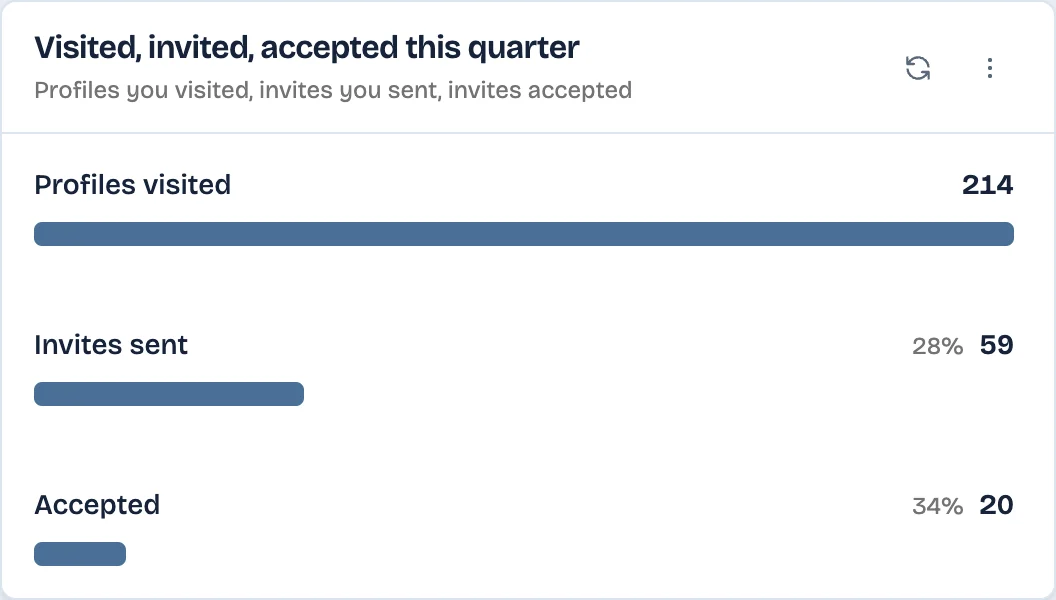
See where your outreach stalls
Turn profiles you visited, invites you sent and invites accepted into one funnel, for any period you name.
LinkedIn analytics, post-analytics tools and LinkedAsk
| LinkedIn’s own analytics | Post-analytics tools | With LinkedAsk | |
|---|---|---|---|
| Post impressions and followers | Yes | Yes | The post stats it recorded, over time |
| Acceptance rate of your invites | No | No | Yes |
| Profiles you visited, over time | No | No | Yes |
| Who viewed you, kept past the window | Last 3 (free) | No | Every viewer it saw |
| Your own question as a chart | No | No | Yes, in plain English |
| Saved to a dashboard | Fixed page | Fixed reports | Yes, runs again when you open it |
What it cannot do
- It starts on the day you install it. It cannot chart activity from before that, and it counts only the invites it saw you send.
- It only knows what LinkedAsk recorded. Messages are kept only for people on your watchlist, and follower lists only as far as LinkedIn showed them to you.
- Viewer dates are as precise as LinkedIn’s own labels (“3d ago”), so views per day are approximate.
- Anonymous viewers stay anonymous.
- If your data cannot answer a question, the chat says so instead of guessing.
- Each chat answer uses a credit. Saved charts on your dashboard do not. See pricing for what is included.
AI chart builder: questions
How do I see my LinkedIn connection acceptance rate?
LinkedIn does not show it. With LinkedAsk installed, each invite you send is recorded along with whether the person connected, so you can ask “what share of my invites were accepted this month” and get the number and a chart. It counts invites sent after you installed it.
Can I make a chart of my LinkedIn connections growth?
Yes. Ask “how did my connections grow this month” and you get a line or area chart you can save to your dashboard. It starts from the day you install.
Do I need to know SQL or a spreadsheet to build these charts?
No. You write a sentence and the chat builds the chart. The query it ran sits under the chart if you want to check it.
Can I ask for a list of people, not just a chart?
Yes, for example “who viewed my profile this month that I am not connected with”. You get names with headline and connection degree, and you can save the list to your dashboard too.
Can I use ChatGPT or Claude instead of the built-in chat?
Yes. Connect LinkedAsk to Claude, ChatGPT or Cursor over MCP and ask the same questions there; it can also save charts to your LinkedAsk dashboard. The built-in chat uses credits, see pricing.
Ask your first question today
Your history starts the day you install. The sooner it starts, the more there is to chart.